I have been tracking the Xfinity brand with renewed interest since the debut of their Jurassic Park campaign. Whenever a high-profile execution hits the market, my first step is to consult Google Trends to evaluate brand search over the long term.
The historical data for Xfinity reveals a significant pattern. A dramatic increase in brand search during the early stages of the business was followed by a sustained decrease. More recently, since April 2025, the brand has returned to growth.
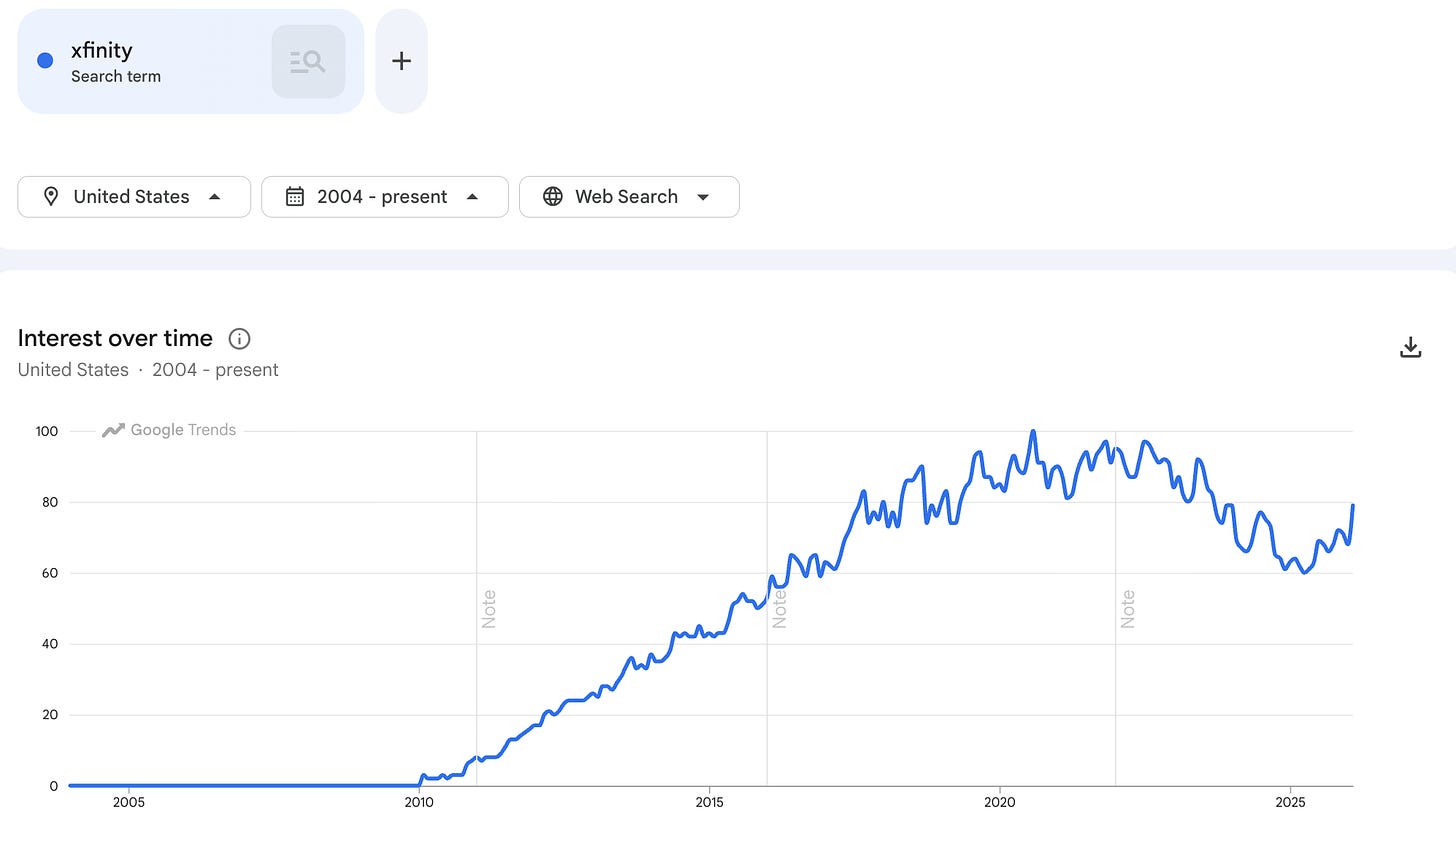
As a strategist, I look for the cause of that initial decline and the mechanics of the current shift. Good creative is rarely an accident; it is the visible result of a coherent strategy and a rigorous brief. I am particularly interested in whether their media strategy can now leverage this momentum across paid, owned, and earned channels.
Developing The Source of Truth
To analyse this transition, I apply the Effectiveness Operating System (eOS). This theoretical framework allows us to map a coherent strategy to the specific KPIs and counter-metrics required to measure marketing effectiveness.
The initial search crash was a failure of trust. Xfinity created an identity they had not earned, prioritising technical claims like 10G while consumers struggled with price hikes and hidden fees. Through the eOS process, we can see that this created a profound trust gap.
Diagnosing the Crux. Aka Richard Rumelt thinking
The current recovery is driven by a shift in the guiding policy. Xfinity replaced rhetorical promises with structural trust by launching a five-year price guarantee and simplified pricing. This policy addressed the core business challenge: a credibility deficit.
The Jurassic Park ad solves the brand crux by using a counter-factual narrative. By asking what would happen if the park stayed connected, the creative handles the heavy lifting of reliability without relying on technical jargon. Xfinity is positioned as the infrastructure that prevents chaos.
[Embedded video — see original post]
The Nuances in KPIs and Counter-Metrics
To remain effective in the long term, a strategy must be anchored by clear accountability metrics. To avoid the traps of the past, Xfinity’s eOS uses a check and balance system—pairing primary business results with rigorous counter-metrics. This moves marketing from a dull cost center to an effectiveness engine for business growth.
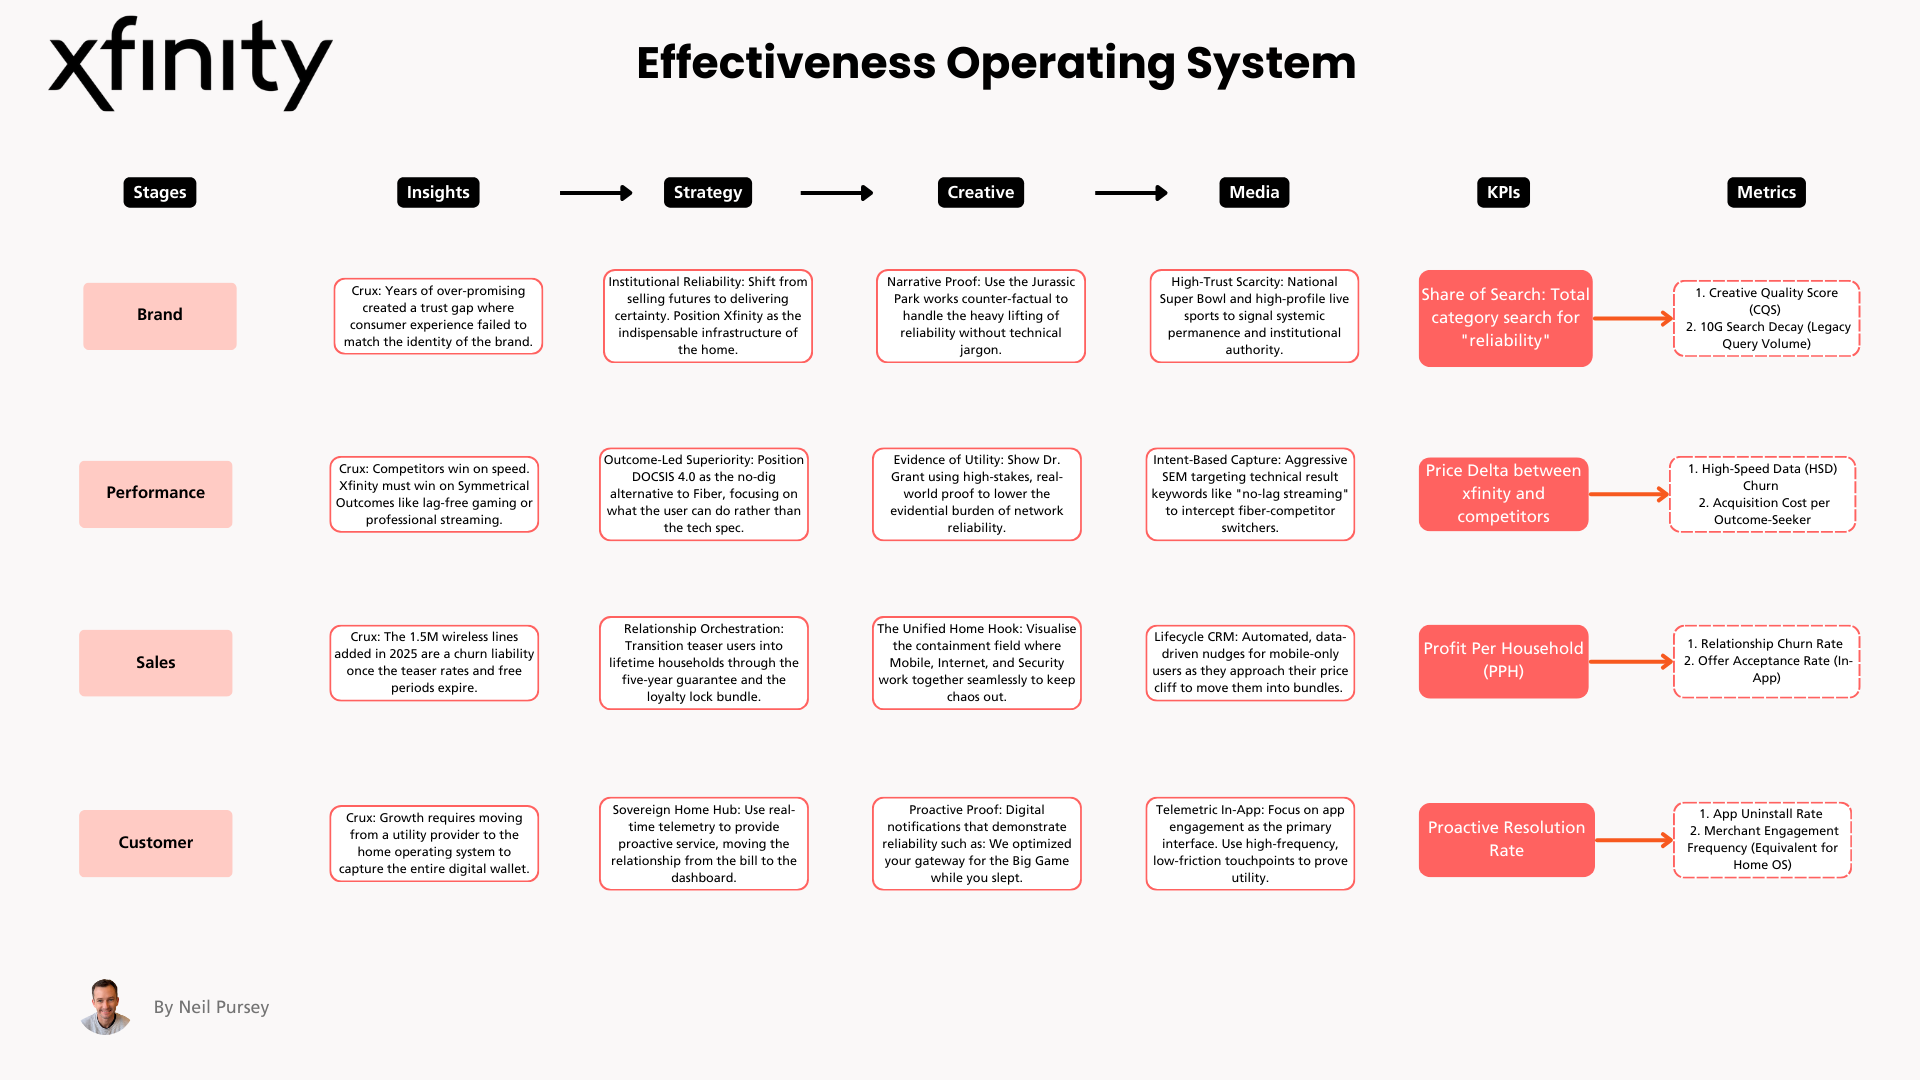
1. Brand
From Visibility to Infrastructure Trust
Why use defensive vetting terms? Because for an ISP, reliability is only felt when it’s missing. We are measuring the trust gap. The goal is to move from selling futures to delivering certainty. We measure this through a dual-lens search audit using tools like MyTelescope.
-
KPI: Share of Search (Reliability)
- The Logic: We are measuring the Trust Gap. We track Xfinity searches paired with defensive vetting terms like ”uptime percentage”, ”outage history”, and ”5 year guarantee reviews”.
- Strategic Significance: If searches for Xfinity + price are high but Xfinity + reliability are low, it means people are only considering you because you’re cheap. To close the trust gap, you need the volume of reliability pairings to increase.
-
Counter-Metric: Creative Quality Score (CQS)
- The Logic: This is our narrative insurance. It ensures that as the Jurassic Park narrative is adapted across platforms, its distinctive brand assets—the Jurassic theme, the logo, the tone—remain intact. If these JP plus Xfinity’s distinctive brand assets disappear in a 6-second bumper, the mental shortcuts that build credibility are lost.
-
Counter-Metric: 10G Search Decay
- The Logic: This is our legacy cleanup metric. Success is also about the death of the old. We track the decline of confusion-based searches to ensure the 10G hangover is finally over.
2. Performance
Capturing the Outcome-Seeker
Why outcome-seekers instead of speed-seekers? Because fiber wins the raw speed war on paper. Xfinity wins by selling symmetrical outcomes (lag-free gaming/streaming) via DOCSIS 4.0.
-
KPI: Propensity to Pay Premium
- The Logic: This is the antidote to commodity. If we successfully sell reliability, customers should be willing to pay a price delta over generic fiber rivals. If we can’t maintain this gap, the brand story hasn’t added actual business value.
-
Counter-Metric: High-Speed Data (HSD) Churn
- The Logic: This is our relationship health monitor. It ensures performance marketing isn’t just buying users who leave the moment the product reality fails to match the Super Bowl promise.
-
Counter-Metric: Acquisition Cost per Outcome-Seeker
- The Logic: We isolate spend on utility keywords—like
“best internet for professional gaming no lag” or “stable wifi for 4k video calls”. This tracks the cost to convert premium users who value infrastructure over a simple discount.
- Isolate Spend: Identify the ad groups or campaigns targeting those specific outcome keywords.
- Count Conversions: Track how many people who entered through those keywords became paying customers.
3. Sales
Solving for Promo Churn
Why the loyalty lock? In 2025, Xfinity added 1.5M mobile lines, many on teaser rates. This is what I call promo churn. The Sales eOS must transition from acquisition to retention engineering, therefore addressing the Crux.
-
KPI: Profit Per Household (PPH)
- The Logic: We are measuring moat depth. Adding mobile lines is a vanity metric if those lines aren’t profitable. PPH ensures we are building a bundled ecosystem that increases total yield, not just headcount.
-
Counter-Metric: Relationship Churn Rate
- The Logic: This distinguishes between a plan change and a breakup. Losing a single line is a minor adjustment; losing a triple-play household is a catastrophic failure of the promo strategy.
-
Counter-Metric: Offer Acceptance Rate (In-App)
- The Logic: This measures the effectiveness of loyalty lock bundles in converting teaser users into permanent customers before they hit the price cliff.
4. Customer
Moving to the Home Operating System
Why Merchant Engagement? To stop being a dumb pipe, Xfinity must become the interface of the home. We are measuring the transition from a Utility to a Platform.
-
KPI: Proactive Resolution Rate
- The Logic: This is Brand Promise in Action. If the ads say the network is reliable, this metric proves it by fixing issues via telemetry (e.g., optimising a gateway for the Big Game) before the customer even knows they exist.
-
Counter-Metric: App Uninstall Rate
- The Logic: This is our Annoyance Threshold. If we use proactive service as an excuse to spam notifications, users will delete the app. This ensures the Home OS is seen as a tool, not a nuisance.
-
Counter-Metric: Merchant Engagement Frequency
- The Logic: Tracks how often users interact with the ecosystem, indicating we have moved beyond utility to capture the digital wallet.
My Final Verdict
Xfinity has cleared the strategic mist. By grounding their execution in these nuanced KPIs—tracking the defensive vetting of the trust-starved and the utility specification of the outcome-seeker, they can build an effectiveness operating system that can sustain growth.
The fences are powered. The task now is to keep them that way.